Sportnomics
Jesse Wade
2023-12-16
Graph of Batting Average over time; Years with the Highest Batting Average
| yearID | BattingAVGY |
|---|---|
| 2000 | 0.2774184 |
| 1994 | 0.2772283 |
| 1996 | 0.2766927 |
| 2006 | 0.2758470 |
| 1999 | 0.2757424 |
| 2007 | 0.2743564 |
| 1995 | 0.2742016 |
| 1997 | 0.2735748 |
| 2004 | 0.2727717 |
| 1993 | 0.2717308 |

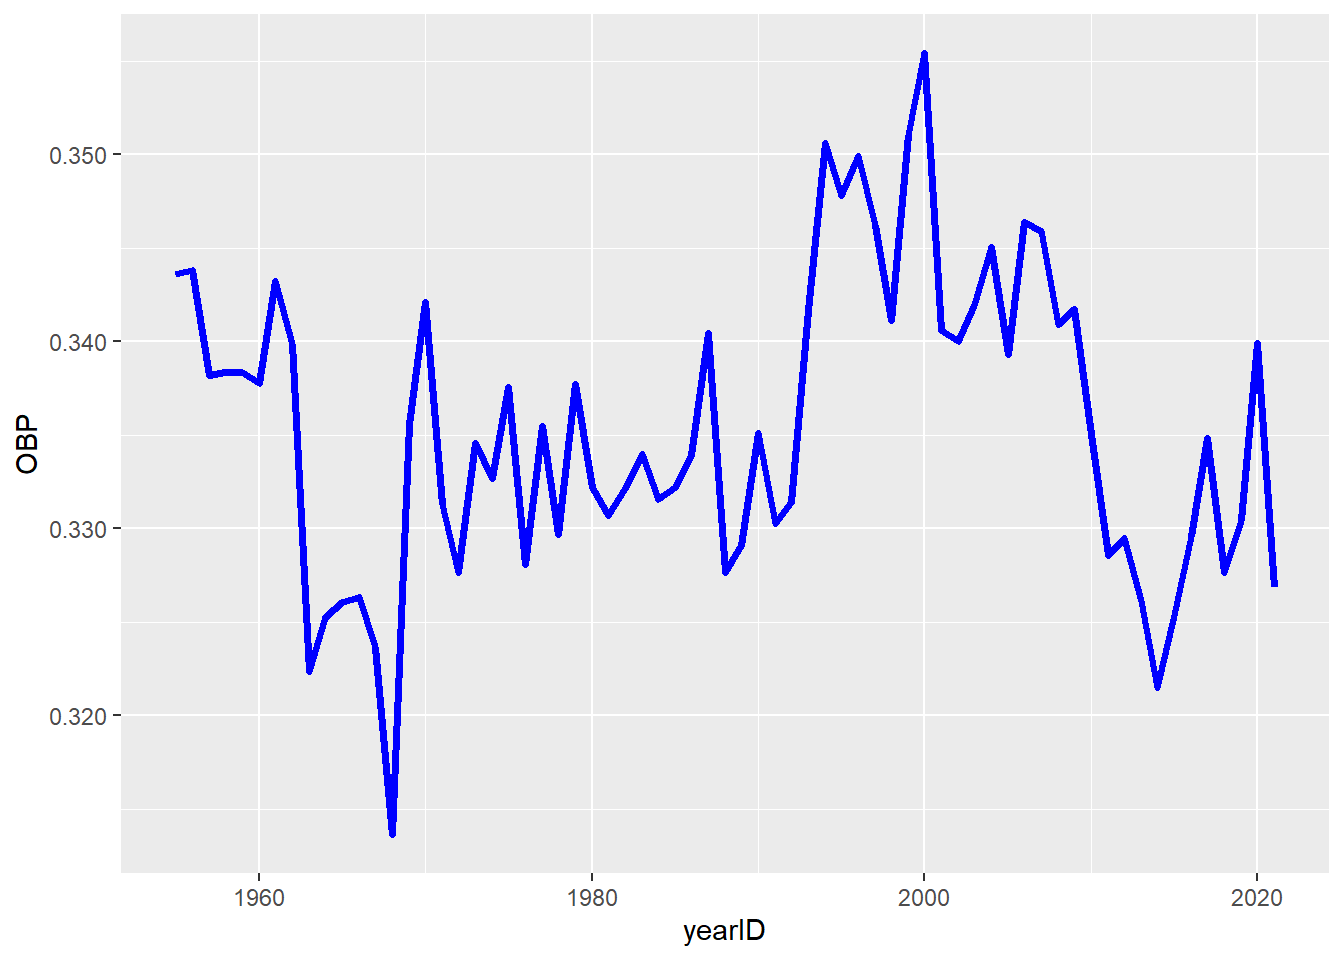
Same Stuff as above but for the On Base Percentage
| yearID | OBP |
|---|---|
| 2000 | 0.3554089 |
| 1999 | 0.3510251 |
| 1994 | 0.3506199 |
| 1996 | 0.3499296 |
| 1995 | 0.3478448 |
| 2006 | 0.3464075 |
| 1997 | 0.3462048 |
| 2007 | 0.3458999 |
| 2004 | 0.3450610 |
| 1956 | 0.3438236 |
| yearID | TotalHR |
|---|---|
| 2019 | 6776 |
| 2017 | 6105 |
| 2021 | 5944 |
| 2000 | 5693 |
| 2016 | 5610 |
| 2018 | 5585 |
| 1999 | 5528 |
| 2001 | 5458 |
| 2004 | 5451 |
| 2006 | 5386 |
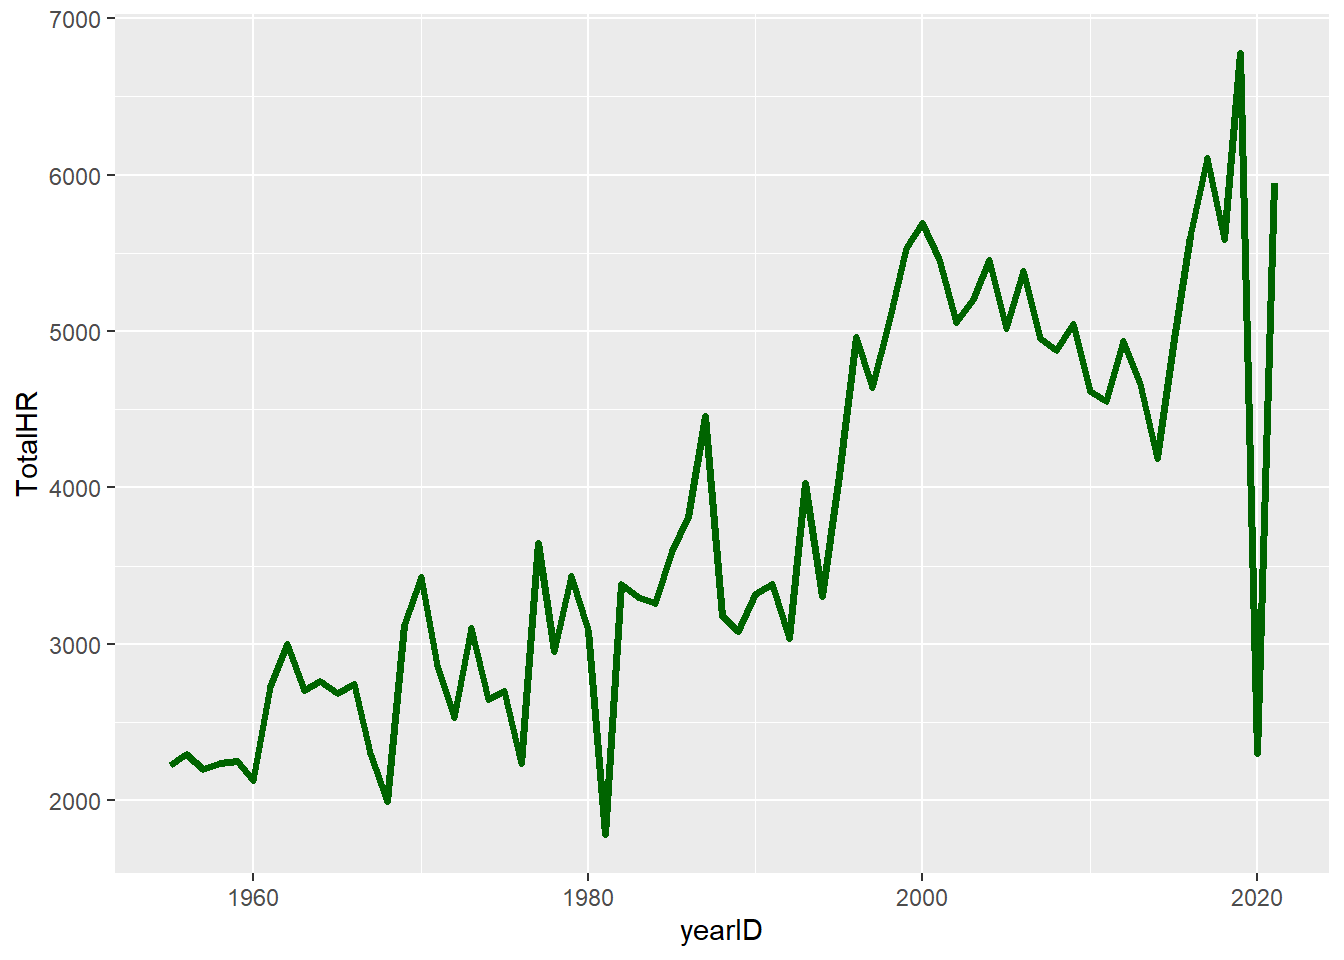
Not sure what to do with 2020 due to it missing so much data with the shortened season.